Types of Data in Statistics: Numerical vs Categorical Data
Collecting different types of data in research can be a powerful tool for businesses as it guides important decisions with facts and figures. The reliance on statistics is growing faster than ever before as it can minimise unconscious bias, feelings and opinions, as data cuts through the noise to offer proven evidence. Statistics are a summary figure, projection or informed estimation and can provide valuable observations when understanding an organisation’s position.
Different types and categories of data can be collected in order to produce a variety of statistics for different industries. Gaining a deeper understanding of data space and the value of each category of data will allow for more opportunity within the business, government and corporate world.
Understanding the difference between Numerical and Categorical data
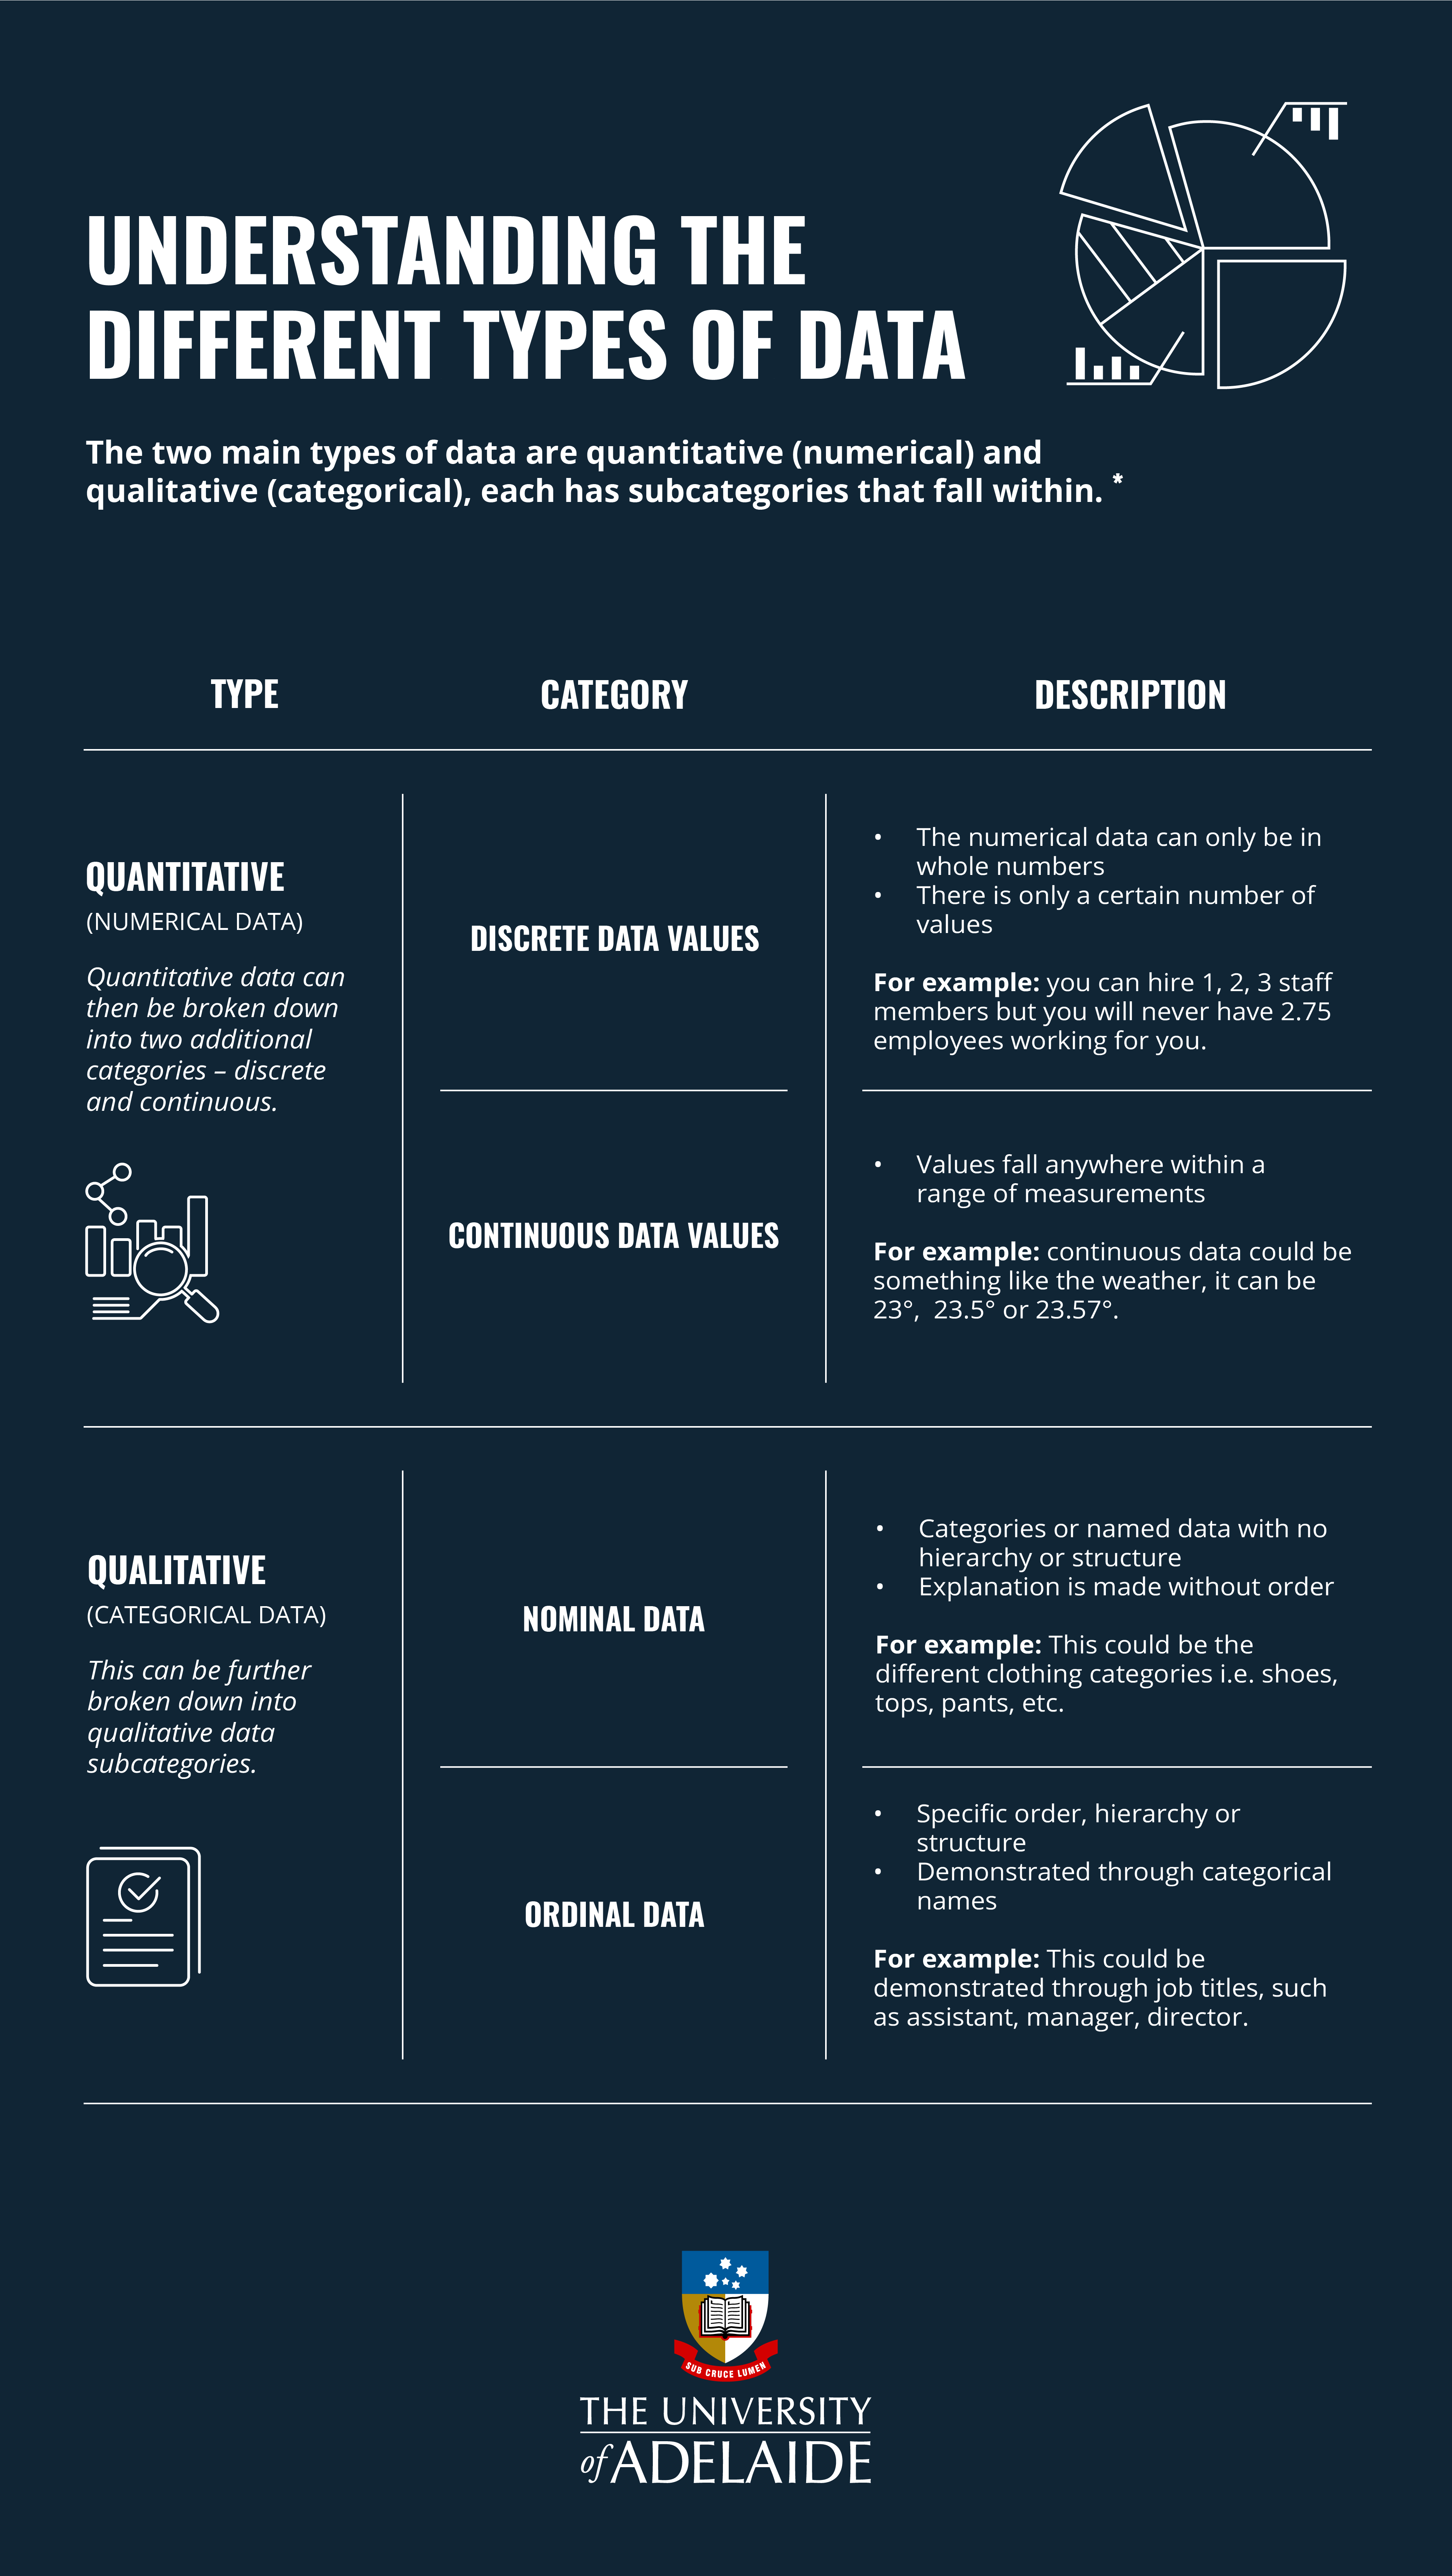
The two main types of data are:
- Quantitative (numerical) data
- Qualitative (categorical) data
Both types of data have subcategories that fall within them shown in more detail below.

* Sources: Statistical Language - What are Statistics?, Australian Bureau of Statistics
Data has endless value - if you know how to use it, Forbes
Quantitative or numerical data
Known as both quantitative and numerical data, its values will always be in a number form. An example of numerical data would be the number of sales made in a particular business quarter. Put simply, if the answer is a number, the data is quantitative (numerical).
Quantitative data can then be broken down into two additional categories of data - discrete and continuous.
1. Discrete data values
Discrete values are when the numerical data can only be in whole numbers, as there is only a certain number of values. Within the context of a business, a discrete data value would be the number of employees within an organisation, you can hire 1, 2, 3 staff members but you will never have 2.75 employees working for you. Discrete data values have distinct, separate values.
2. Continuous data values
Continuous numerical data values will fall anywhere within a range of measurements. With a vast number of options, continuous data values can be slightly different to each other. For example, continuous data could be something like the weather, it can be 23°, 23.5° or 23.57° and so on. In addition, continuous data may change over time, while the weather was 23° today, it may be 27.85° tomorrow. Continuous numerical data provides detailed, nuanced information to businesses wanting to gain further insights, one of the key differences between numerical vs categorical data.
Qualitative or categorical data
Qualitative data is also known as categorical data and it measures data represented by a name or symbol. This could be the names of each department in your organisation, office locations, and many other names that are all categorical data.
This can be further broken down into types of qualitative (categorical) data.
1. Nominal data
Nominal data are categories or named data with no inherent hierarchy or structure, they explain the category without any order. If you had an e-commerce shopping store this could be the different clothing categories you offer i.e. shoes, tops, pants, etc. You could categorise and analyse the different nominal data to understand your business offerings.
2. Ordinal data
Ordinal data demonstrates a specific order, hierarchy or understood structure through the categorical names. This could be demonstrated through job titles, such as assistant, manager, director – these are all names that denote a specific position in the company which is understood by its categorical name.
Once these different types of data have been collected, businesses can start utilising them in important and insightful statistics. These summarising figures will illustrate previous trends that can become useful for future projections, highlighting weaknesses and areas that work well within an organisation.
Important data skills for data science professionals
Hopefully this explanation has given you a good understanding of the types of data in statistics important for research, and the differences between numerical and categorical data. This is a fundamental skill for data science professionals as businesses continue to recognise data's usefulness, and want to track and produce insights with increased detail and capabilities. There are different areas like data science, data analytics, data engineering and more - finding your area within data can be exciting opportunity to grow.
There are a few key skills that unite all areas of data science and are important in becoming a true data scientist.
Some desired data skills include:
- Critical thinking,
- Mathematical abilities,
- Problem-solving,
- Communication.
While each role will require something new, having a methodological and inquisitive mind can help push the data capabilities of a business to produce more nuanced and insightful results.
Gain real data experience
Find your place within the data sphere and provide insights that help to shape real business decisions. Learning data science can transform your career into an exciting pathway with different opportunities. The University of Adelaide offers an online Graduate Certificate in Data Science that helps professionals become job-ready in six months. If looking to become an expert in your field, the online Master of Data Science can equip you with the right skills to succeed. Both programs are taught by a Group of Eight university that has an important influence within the industry, providing factual and reliable resources for those wanting to excel in the data field.
If you’re interested in pursuing a career in data, book an appointment with one of the University of Adelaide’s advisors to discuss your options today.
